University Analysis on Kaggle
I recently stumbled on the competitions page of Kaggle. My first observation was how much money was up for grabs, as the top performers on any given competition can win upwards of $3000 (see this real estate price prediction posting). While looking at the various analyses, I have found some interesting notebooks talking about EDA and regression models (e.g., this post on predicting real-estate prices based on property attributes).
Recently, I have been interested in students outcomes and how they correlate with different facets of universities (e.g., ranking, endowments). It makes sense that the more money or prestige that a given institution has, the better its students will do in their careers, but I would like to pin this intuition to some data. I scraped a dataset from the Center for World University Ranking’s 2019-20 website (the data was posted in a HTML table… who does that?). Then, I posted the scraped data to Kaggle, and I generated a Kernel summarizing the dataset.
The Dataset
The CWUR publishes its methodology for calculating these rankings. However, the values on the site don’t square up with the provided equations; they seem to correspond to a rank-ordering for each category rather than a numeric value on a scale. According to the methodology, a score is assigned to each university as a weighted average (weights in parentheses) of:
- Quality of education (25%)
- Alumni employment (25%)
- Quality of faculty (10%)
- Research performance (40%)
It is reasonable to assume that the global and national ranks assigned based on these scores.
EDA: Global Rankings
Figure 1 shows the top 20 countries represented in the dataset by count. It resembles a Pareto distribution, as the number of top universities per country diminishes precipitously after these top countries. To channel a Bernie-esque citation of statistics, the countries in the top 5% of countries (the U.S., China, Japan, France, and the U.K.) constitute 50% of the entries on the list.
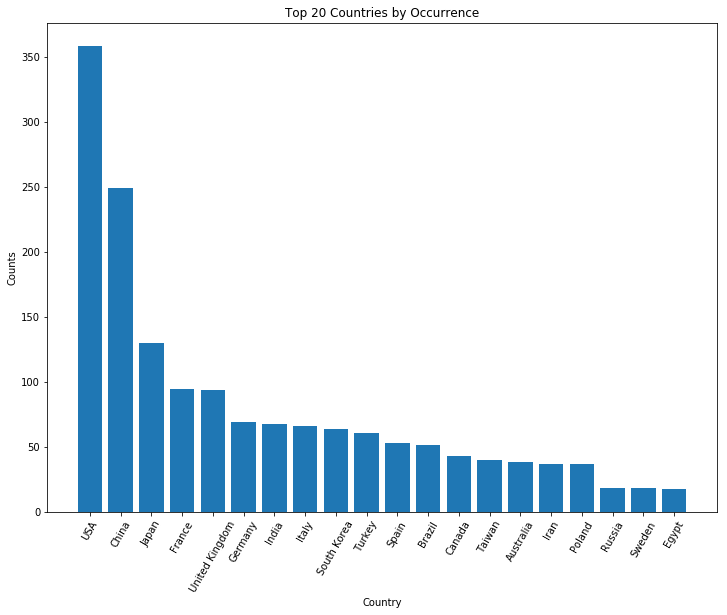
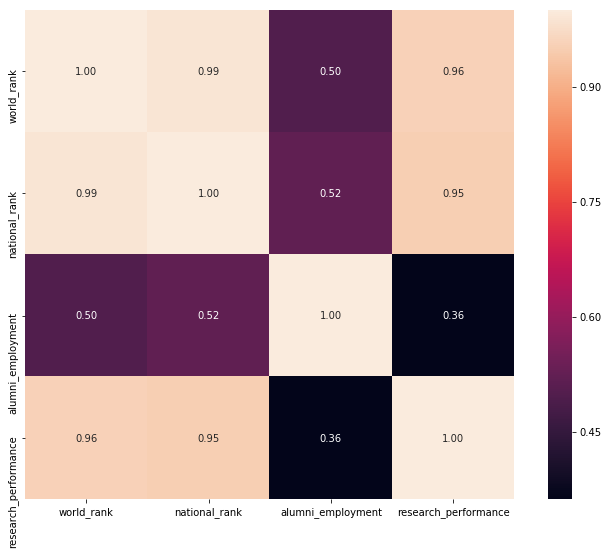
Figure 2 shows the correlation between different features in the dataset. It appears that research performance has the strongest correlation with world rank. However, some of the numbers seem suspect. Notice that national rank doesn’t correlate very strongly with anything. This could be due to the fact that I looked at all locations in the dataset. Correlations between national rank and any other features would be more appropriately assesed after separating the data.
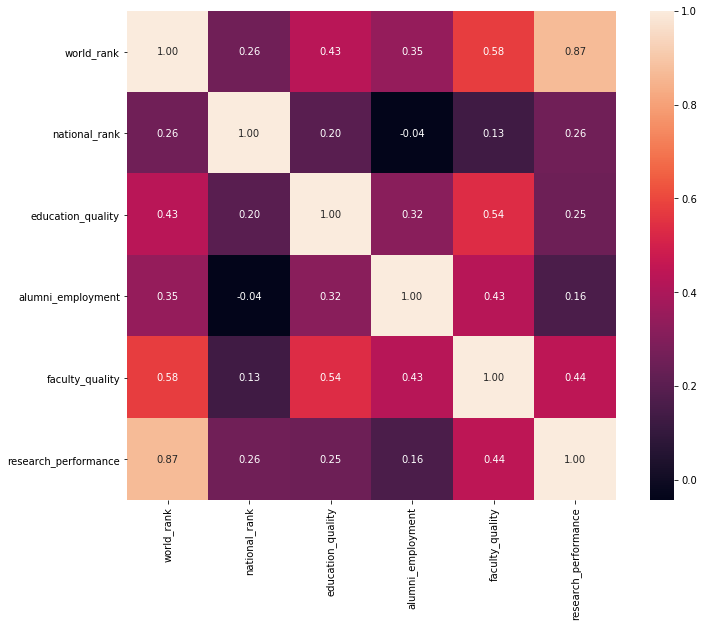
Furthermore, I generated the correlation matrix based on a measly 169 universities out of 2000. It turns out that a lot of fields in the dataset are empty, as per Table 1. In order to make better use of available data, I tried dropping the most sparse columns (i.e., faculty_quality and education_quality) and took another look at the correlation matrix (see Figure 3).
| Feature | Missing Ratio |
|---|---|
| faculty_quality | 87.7% |
| education_quality | 79.1% |
| alumni_employment | 52.4% |
| research_performance | 2.7% |
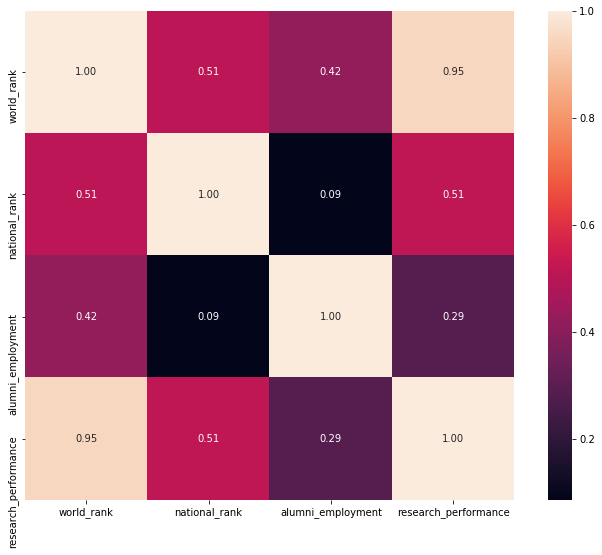
By dropping the two most sparse columns, the correlation matrix is based on 905 out of 2000 universities, and the resulting correlation between world rank and research performance increases to 0.95.
EDA: National Rankings for US Universities
Given the overall sparsity of the dataset, maybe we can say something more useful by restricting our attention to a single country. Looking at all the fully-populated entries (n=64) for US universities (Figure 4), we see that national ranking correlates with all features more strongly than we saw in the global analysis.
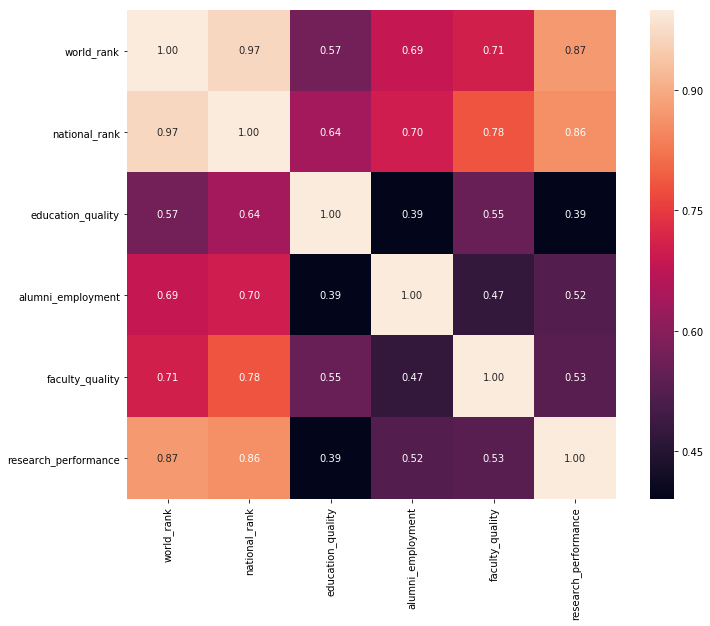
By dropping the same two sparse columns as before, we look at 231 of 358 entries, and now national_rank strongly correlates with research performance even more strongly than before (0.95 vs. 0.86).
All About the Research
What do we take away from this cursory glance at the data? Some general impressions:
- Research Performance: W.r.t. rank, Research Performance seems to be the prime mover. This seems obvious, as the product of academic institutions is ultimately new knowledge in the form of research. CWUR’s methodology generates its score based on a weighted average of the four features described earlier, and research is weighted 40%. This emphasis on research also bears itself out in the sparsity of the dataset: only 2.7% of universities were missing ‘research_performance’ data while all other features were absent in a majority of entries.
- Student Outcomes: My initial intuition was “If the rank of your alma mater is high, then your ultimate academic/professional achievement will be commensurately high.” This seems sensible, but CWUR’s methodology inverts the causality (i.e., better outcomes imply better rankings). So for this particular dataset, the ‘alumni_employment’ correlates with rank by design. Additionally, the definition of this particular metric is rather limited; the CWUR defines “Alumni Employment” as “… the number of a university’s alumni who have held CEO positions at the world’s top companies relative to the university’s size.” Ideally, we would have a feature which captures student achievement more broadly than the uppermost stratum of professional hierarchies.
So no groundbreaking discoveries regarding university outcomes and rankings to be had here. But I got the chance to scrape and wrangle some data, contributed to the data corpus of Kaggle, and got the chance to do EDA with some new Python libraries. Sunday well spent!
In the future, I’d like to find some different datasets with more features relating to student outcomes (i.e., starting salaries, graduate school admissions, postdoctoral positions, fellowships, etc.).